
PRM Analysis Pipeline
PRM Analysis Pipeline
Protected corpus → controlled transforms → tokenization → slicing → measurement → validation → aggregate evidence.
Protected corpus → controlled transforms → tokenization → slicing → measurement → validation → aggregate evidence.
The analytical engine behind PRM converts rights-controlled human-language data into reproducible metrics, comparisons, charts, and review-ready evidence.
The analytical engine behind PRM converts rights-controlled human-language data into reproducible metrics, comparisons, charts, and review-ready evidence.
Seven-Stage Measurement System
Seven-Stage Measurement System
Public outputs expose the results and measurement path. Protected source text and reconstructable mappings remain controlled.
01
Rights-Controlled Source Corpus
Rights-Controlled Source Corpus
The original human-authored corpus remains intact, versioned, and protected inside the private data boundary.
The original human-authored corpus remains intact, versioned, and protected inside the private data boundary.
↓
02
Analytical Dataset Transforms
Analytical Dataset Transforms
Controlled RMR and TQT versions prepare the corpus for structural, linguistic, tokenizer, and slice-based analysis.
Controlled RMR and TQT versions prepare the corpus for structural, linguistic, tokenizer, and slice-based analysis.
↓
03
Tokenizer and Slice Runs
Tokenizer and Slice Runs
Each analytical version is processed across declared tokenizers, slice sizes, corpus divisions, and comparison conditions.
Each analytical version is processed across declared tokenizers, slice sizes, corpus divisions, and comparison conditions.
↓
04
Metric Families
Metric Families
Measures entropy, lexical diversity, repetition control, semantic and syntactic structure, phonetic behavior, rhyme architecture, and chronological change.
Measures entropy, lexical diversity, repetition control, semantic and syntactic structure, phonetic behavior, rhyme architecture, and chronological change.
↓
05
Aggregate Index and Summary Layer
Aggregate Index and Summary Layer
Validated measurements are compiled into EURE, LDI, RACS, trend summaries, rankings, and aggregate comparison outputs.
Validated measurements are compiled into EURE, LDI, RACS, trend summaries, rankings, and aggregate comparison outputs.
↓
06
Evidence and Visualization Layer
Evidence and Visualization Layer
Results become charts, dashboards, tables, captions, and documented findings for public and technical review.
Results become charts, dashboards, tables, captions, and documented findings for public and technical review.
↓
07
Controlled Technical Review
Controlled Technical Review
Qualified review can extend to source manifests, private mappings, provenance records, and reproducibility materials under appropriate terms.
Qualified review can extend to source manifests, private mappings, provenance records, and reproducibility materials under appropriate terms.
Traceability and Integrity Controls
Traceability and Integrity Controls
Versioning, checkpoints, hash records, manifests, and review logs create a traceable path from controlled source material to every published result.
Versioning, checkpoints, hash records, manifests, and review logs create a traceable path from controlled source material to every published result.
What the Pipeline Delivers
What the Pipeline Delivers
The pipeline turns a rights-controlled human-language corpus into reproducible measurements, documented findings, review-ready evidence, and licensing-ready analytical assets.
The pipeline turns a rights-controlled human-language corpus into reproducible measurements, documented findings, review-ready evidence, and licensing-ready analytical assets.
Stages
Stages
Secure and version the source corpus inside the private data boundary
Generate the RMR and TQT analytical transforms
Process the declared tokenizer families
Generate fixed-size slice windows and controlled corpus divisions
Run the linguistic, structural, phonetic, rhyme, and chronological metric families
Compile validated results into summary workbooks and aggregate indexes
Generate charts, tables, dashboards, and comparison outputs
Package public evidence and controlled-review materials
Secure and version the source corpus inside the private data boundary
Generate the RMR and TQT analytical transforms
Process the declared tokenizer families
Generate fixed-size slice windows and controlled corpus divisions
Run the linguistic, structural, phonetic, rhyme, and chronological metric families
Compile validated results into summary workbooks and aggregate indexes
Generate charts, tables, dashboards, and comparison outputs
Package public evidence and controlled-review materials
What Each Stage Protects
What Each Stage Protects
PRM separates the source corpus, analytical datasets, and published evidence into distinct access layers. Raw text and reconstructable mappings remain inside the controlled environment, while public outputs expose aggregate behavior, methodology, comparisons, and charted results.
RMR and TQT transforms allow the corpus to be examined through multiple structural and tokenizer lenses. Fixed-size slice runs test whether findings persist across the dataset instead of depending on selected excerpts. Validated workbooks, aggregate indexes, and chart exports preserve a reviewable trail from measurement to presentation.
PRM separates the source corpus, analytical datasets, and published evidence into distinct access layers. Raw text and reconstructable mappings remain inside the controlled environment, while public outputs expose aggregate behavior, methodology, comparisons, and charted results.
RMR and TQT transforms allow the corpus to be examined through multiple structural and tokenizer lenses. Fixed-size slice runs test whether findings persist across the dataset instead of depending on selected excerpts. Validated workbooks, aggregate indexes, and chart exports preserve a reviewable trail from measurement to presentation.
What the Pipeline Establishes
What the Pipeline Establishes
The pipeline establishes that PRM results are produced through a defined, repeatable sequence from versioned source corpus to validated aggregate output. Each stage has a specific analytical function and produces reviewable materials for the stage that follows.
Public presentation stops at the aggregate evidence layer. Source manifests, provenance records, private mappings, and reproducibility materials are available through controlled technical review under appropriate terms.
The pipeline establishes that PRM results are produced through a defined, repeatable sequence from versioned source corpus to validated aggregate output. Each stage has a specific analytical function and produces reviewable materials for the stage that follows.
Public presentation stops at the aggregate evidence layer. Source manifests, provenance records, private mappings, and reproducibility materials are available through controlled technical review under appropriate terms.
Reproducibility as Product Infrastructure
Reproducibility as Product Infrastructure
Reproducibility separates a finished data product from a collection of attractive results. PRM retains its declared inputs, transforms, tokenizer conditions, slice sizes, metric definitions, validation records, and output artifacts so every published finding has a documented route through the measurement system.
That repeatable structure supports technical diligence, comparison reruns, additional metric families, controlled source review, and future licensing use. The charts are the visible layer. The reusable analytical system is the product infrastructure beneath them.
Reproducibility separates a finished data product from a collection of attractive results. PRM retains its declared inputs, transforms, tokenizer conditions, slice sizes, metric definitions, validation records, and output artifacts so every published finding has a documented route through the measurement system.
That repeatable structure supports technical diligence, comparison reruns, additional metric families, controlled source review, and future licensing use. The charts are the visible layer. The reusable analytical system is the product infrastructure beneath them.
Pipeline Outputs and Evidence Coverage
Pipeline Outputs and Evidence Coverage
These charts show what the pipeline produces, how broadly the corpus is measured, and how results move from raw metrics into aggregate indexes.
Use the coverage dashboards to inspect the measurement surface, then follow the slice, trend, and index views to see how the evidence is compared and summarized.
These charts show what the pipeline produces, how broadly the corpus is measured, and how results move from raw metrics into aggregate indexes.
Use the coverage dashboards to inspect the measurement surface, then follow the slice, trend, and index views to see how the evidence is compared and summarized.
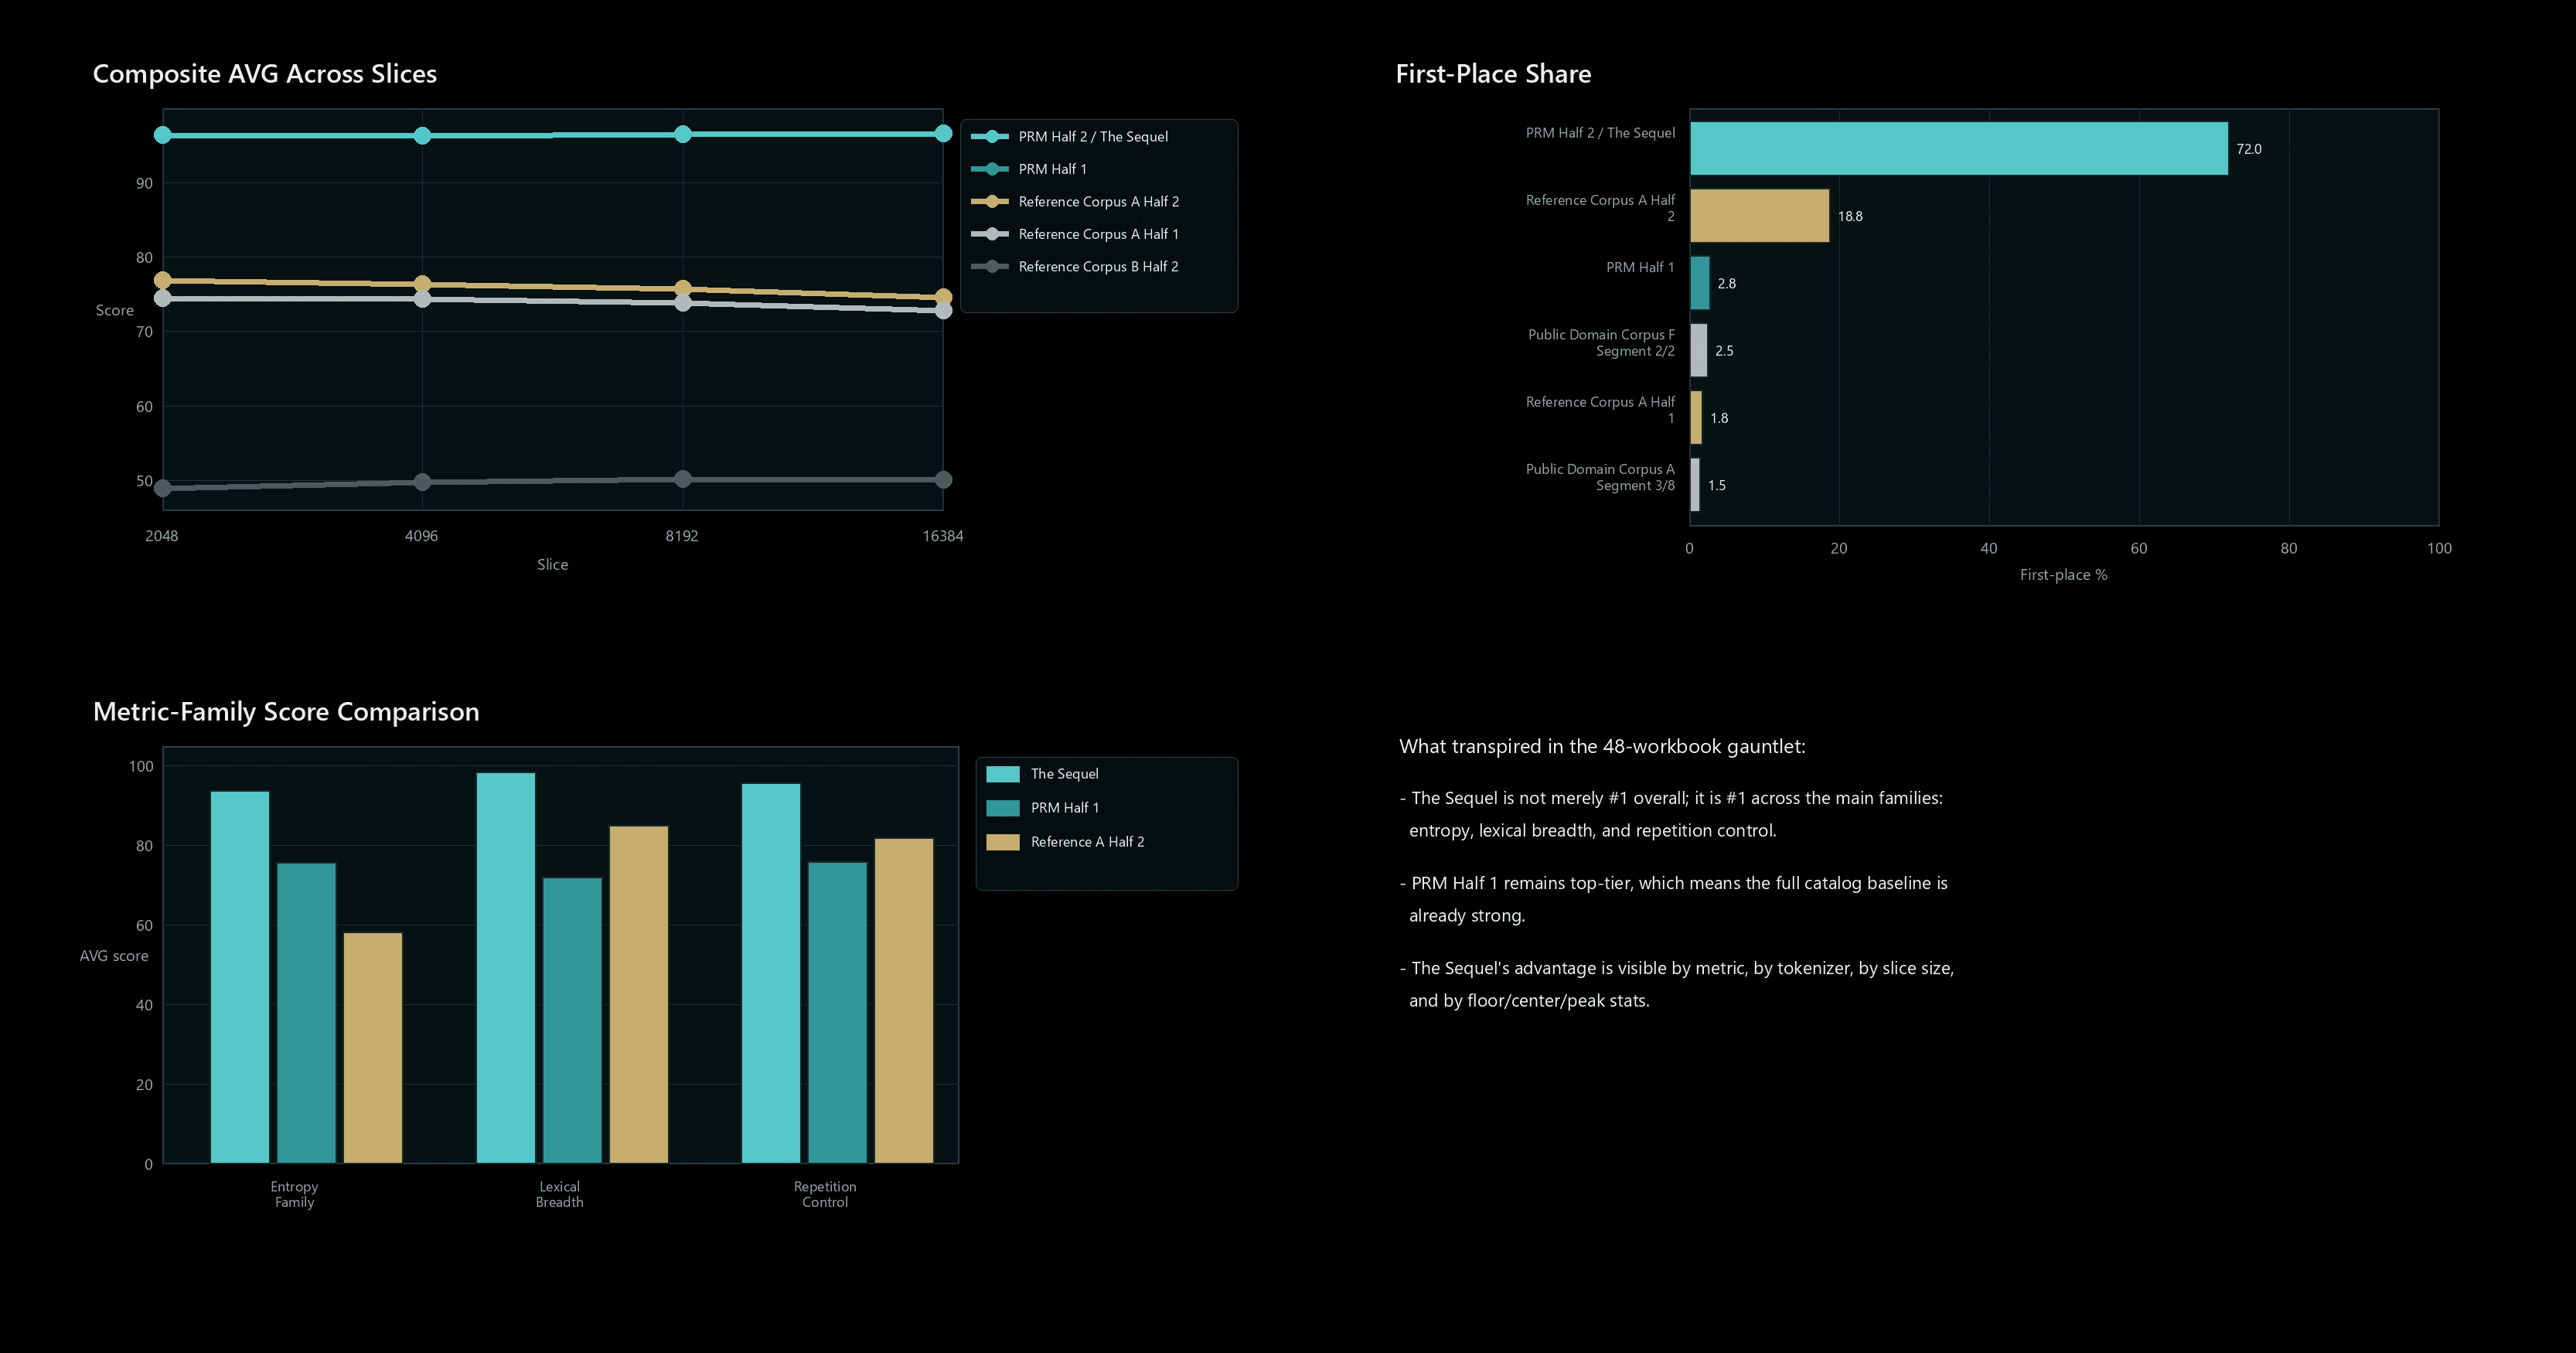
Pipeline Evidence Coverage
Pipeline Evidence Coverage
Frames the dataset evidence as coverage, not a corpus download.
Frames the dataset evidence as coverage, not a corpus download.
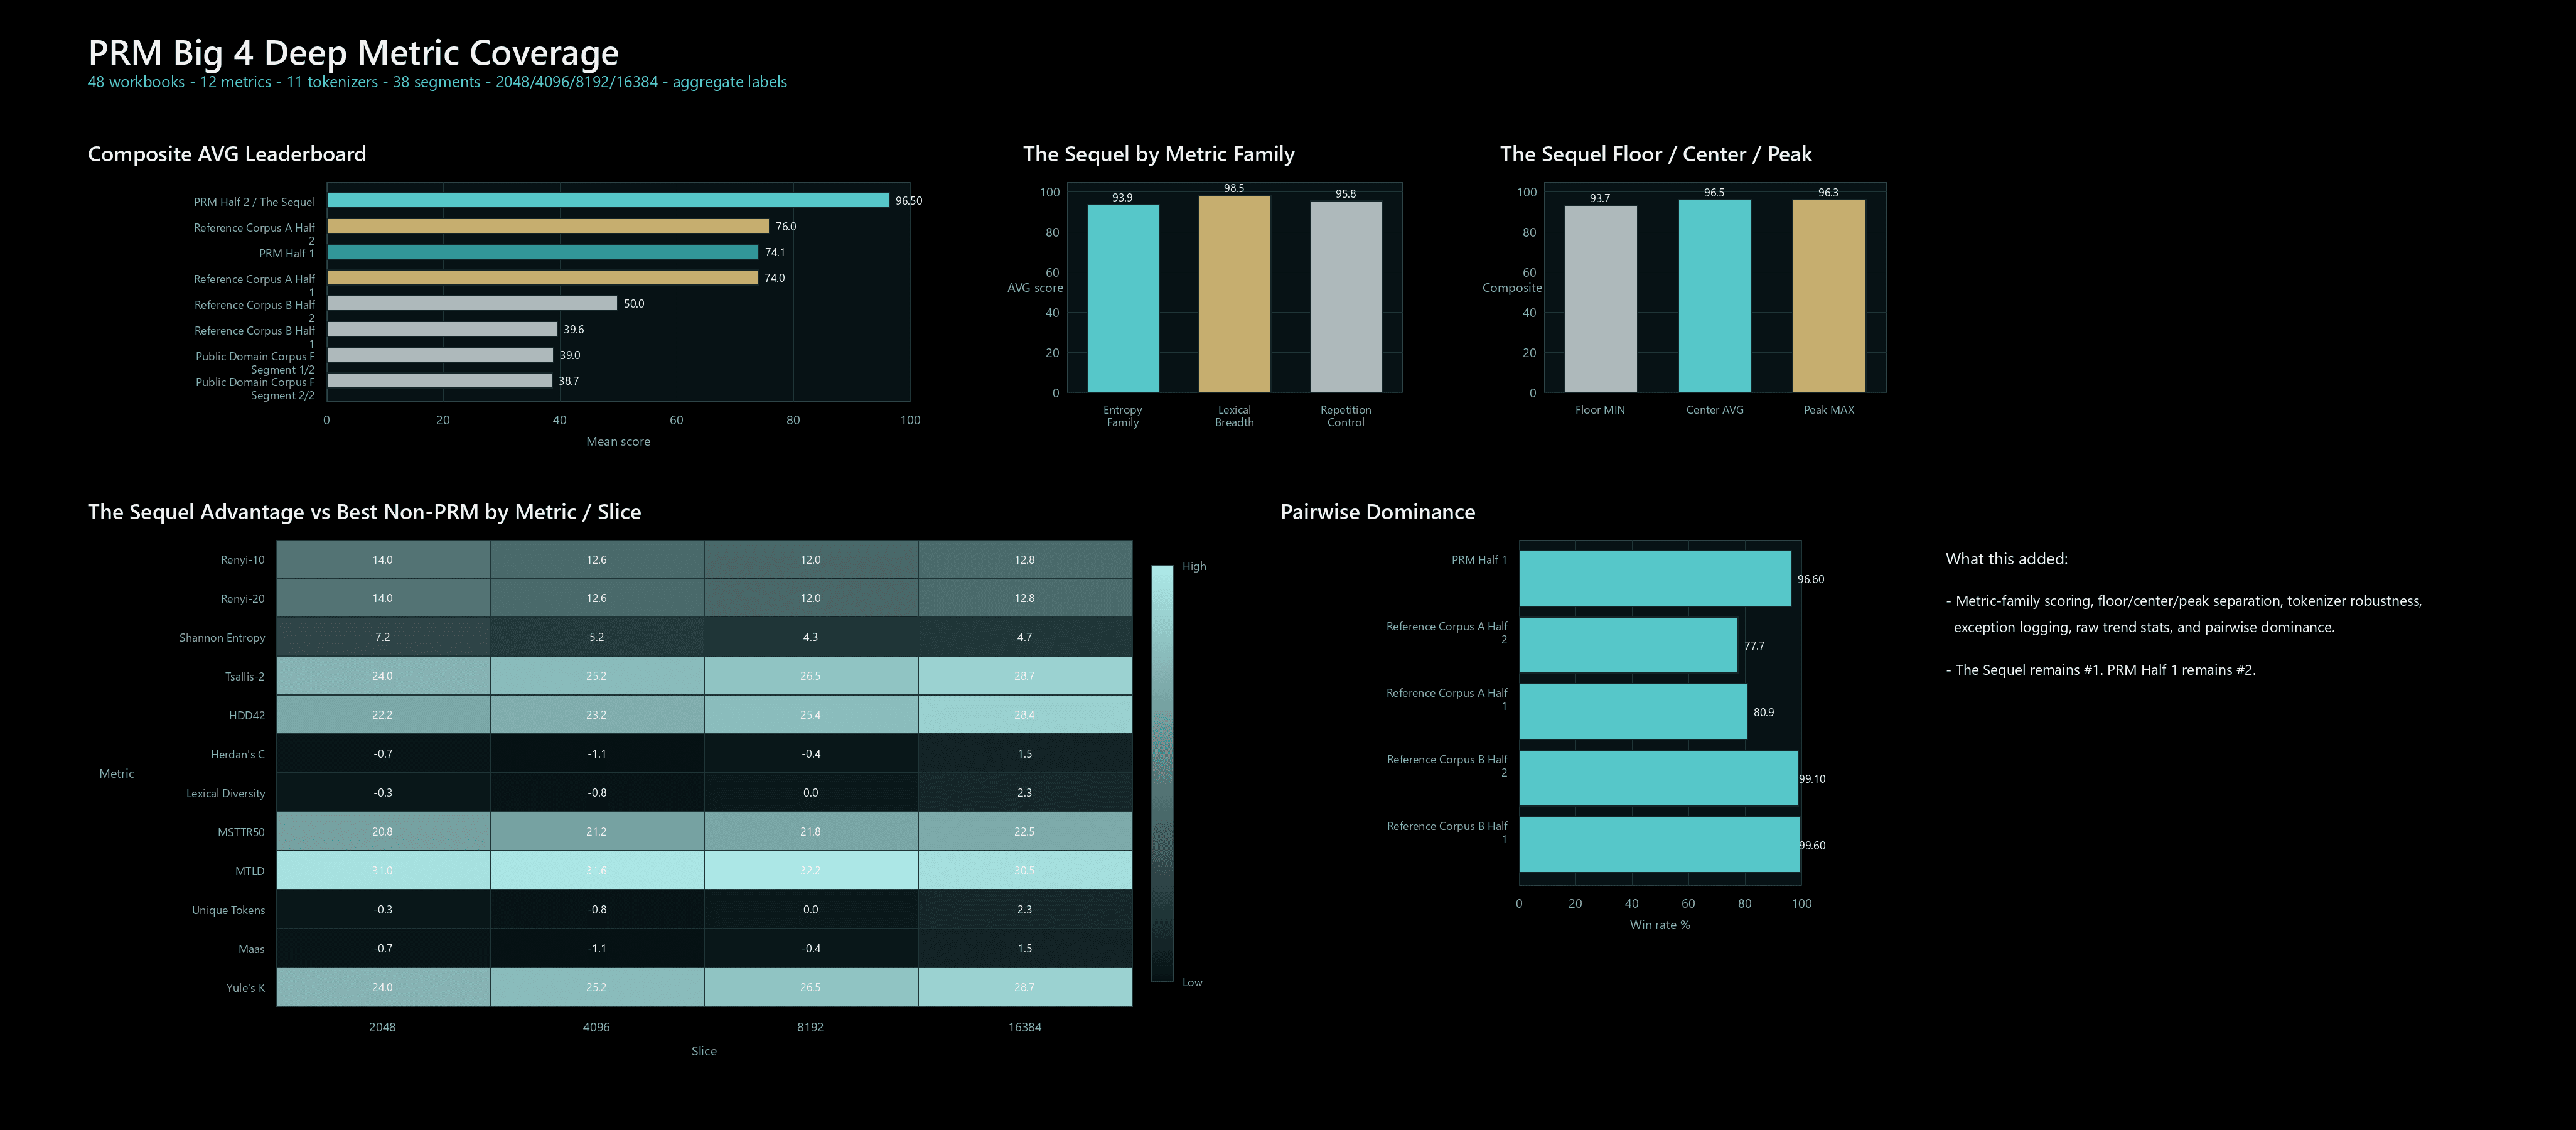
Deep metric coverage dashboard
Deep metric coverage dashboard
Summarizes how much measurement sits behind the public evidence layer.
Summarizes how much measurement sits behind the public evidence layer.
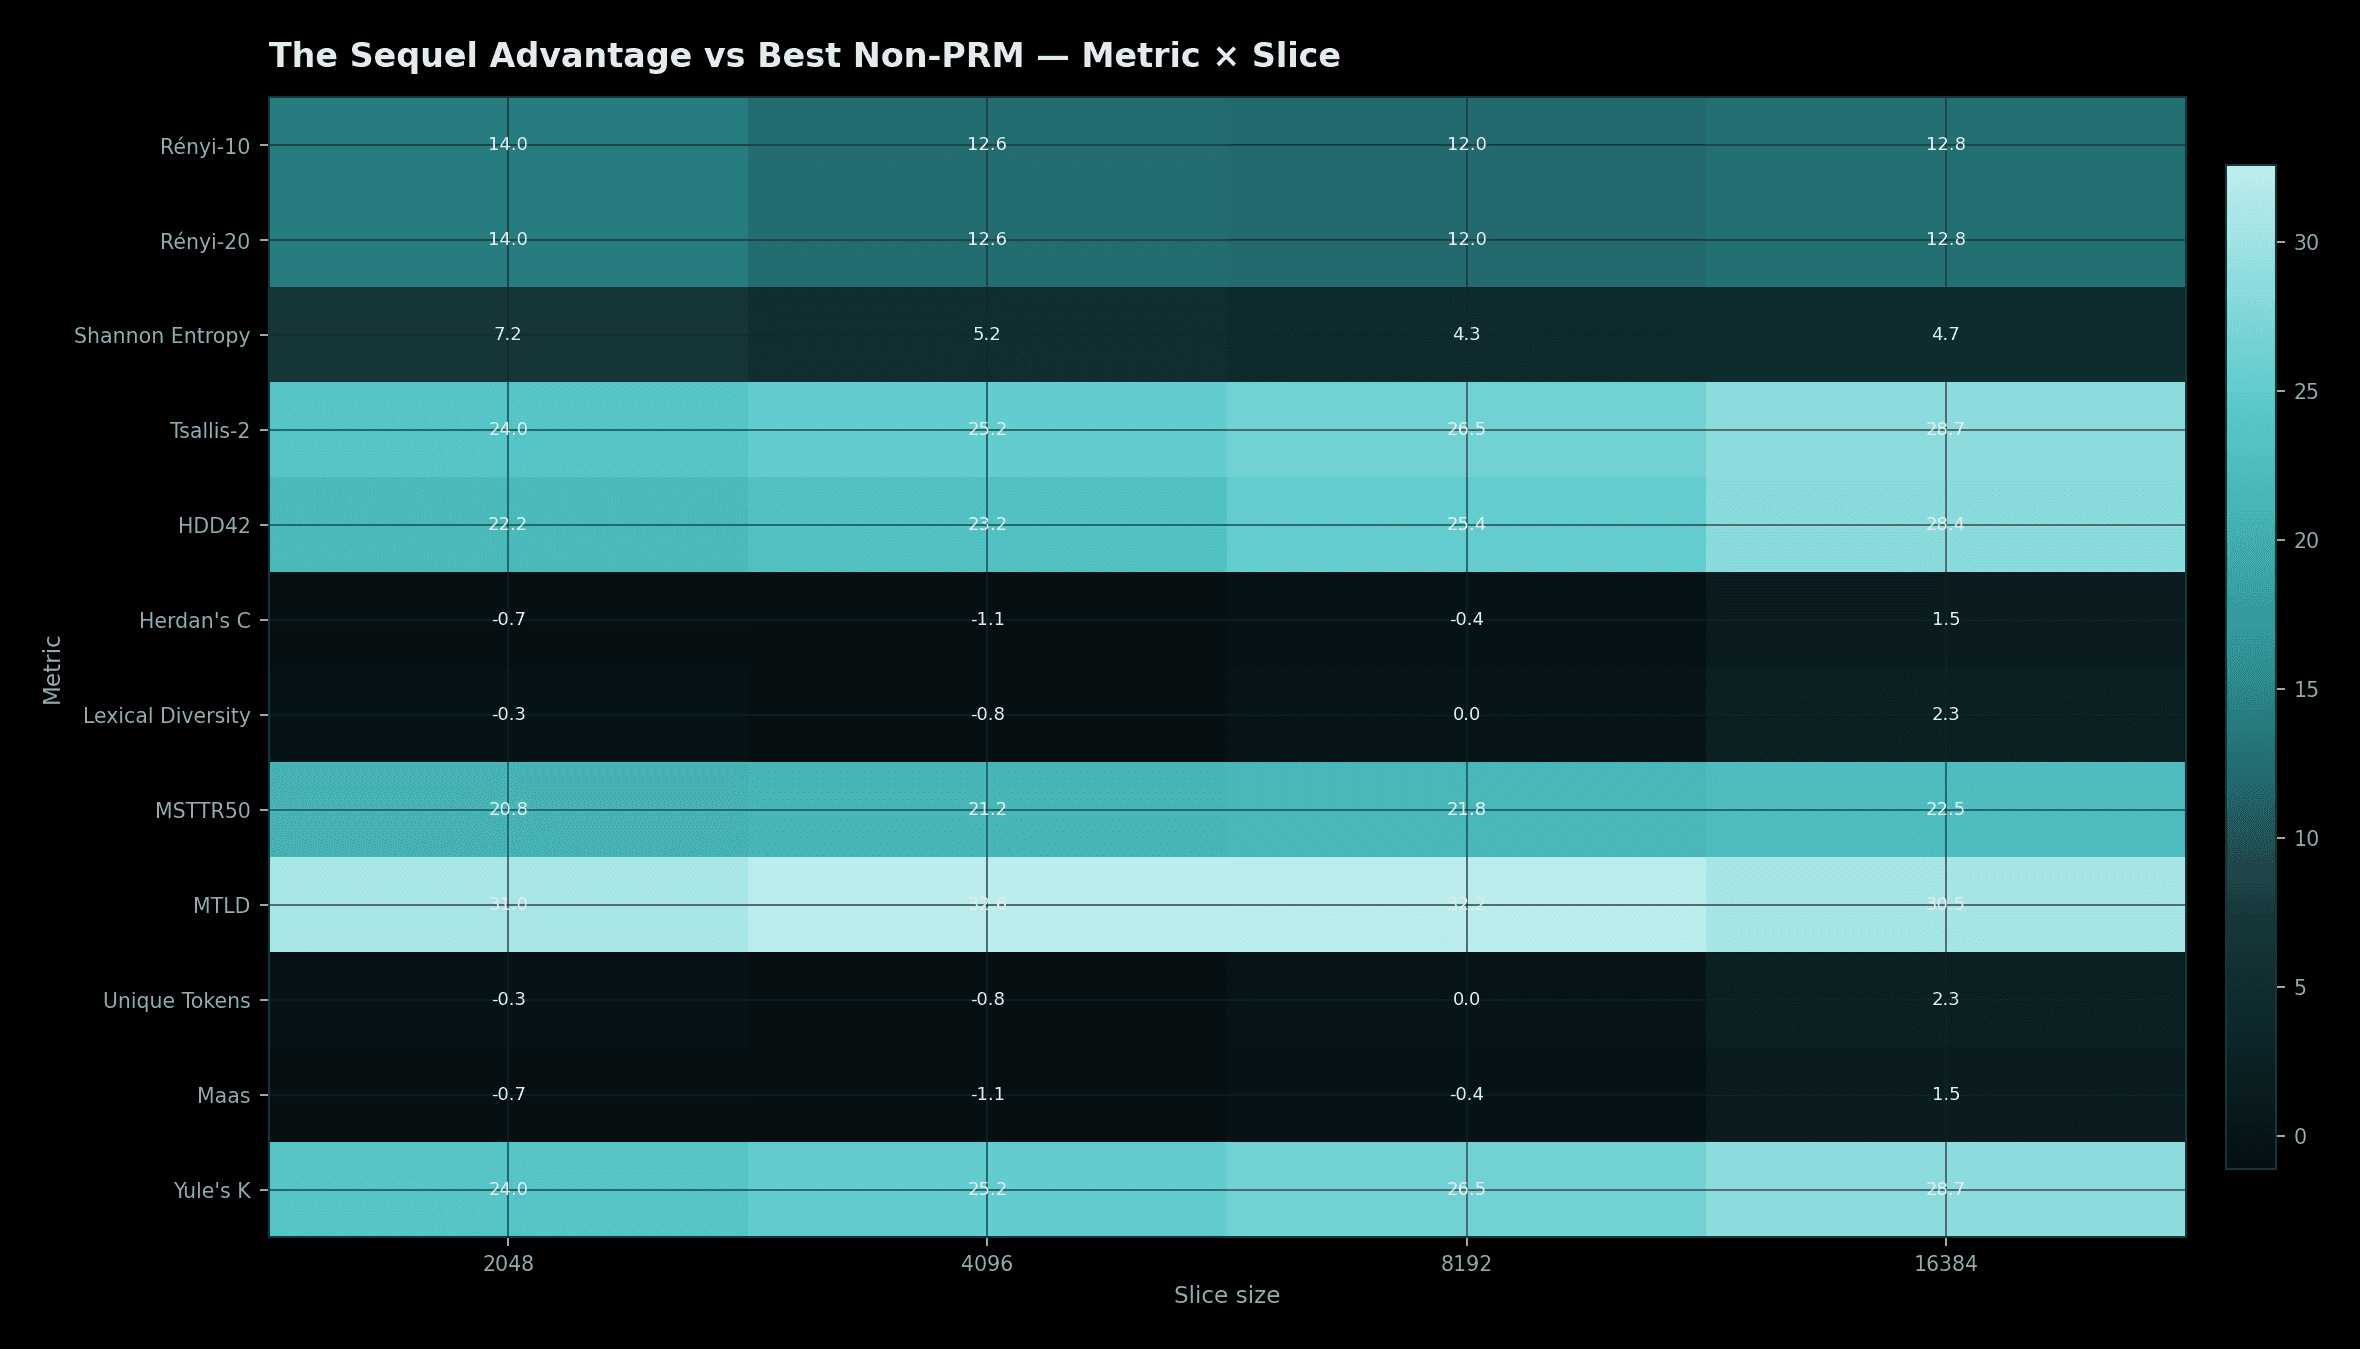
Metric slice delta heatmap
Metric slice delta heatmap
Maps metric deltas across Solo Dataset slices.
Maps metric deltas across Solo Dataset slices.
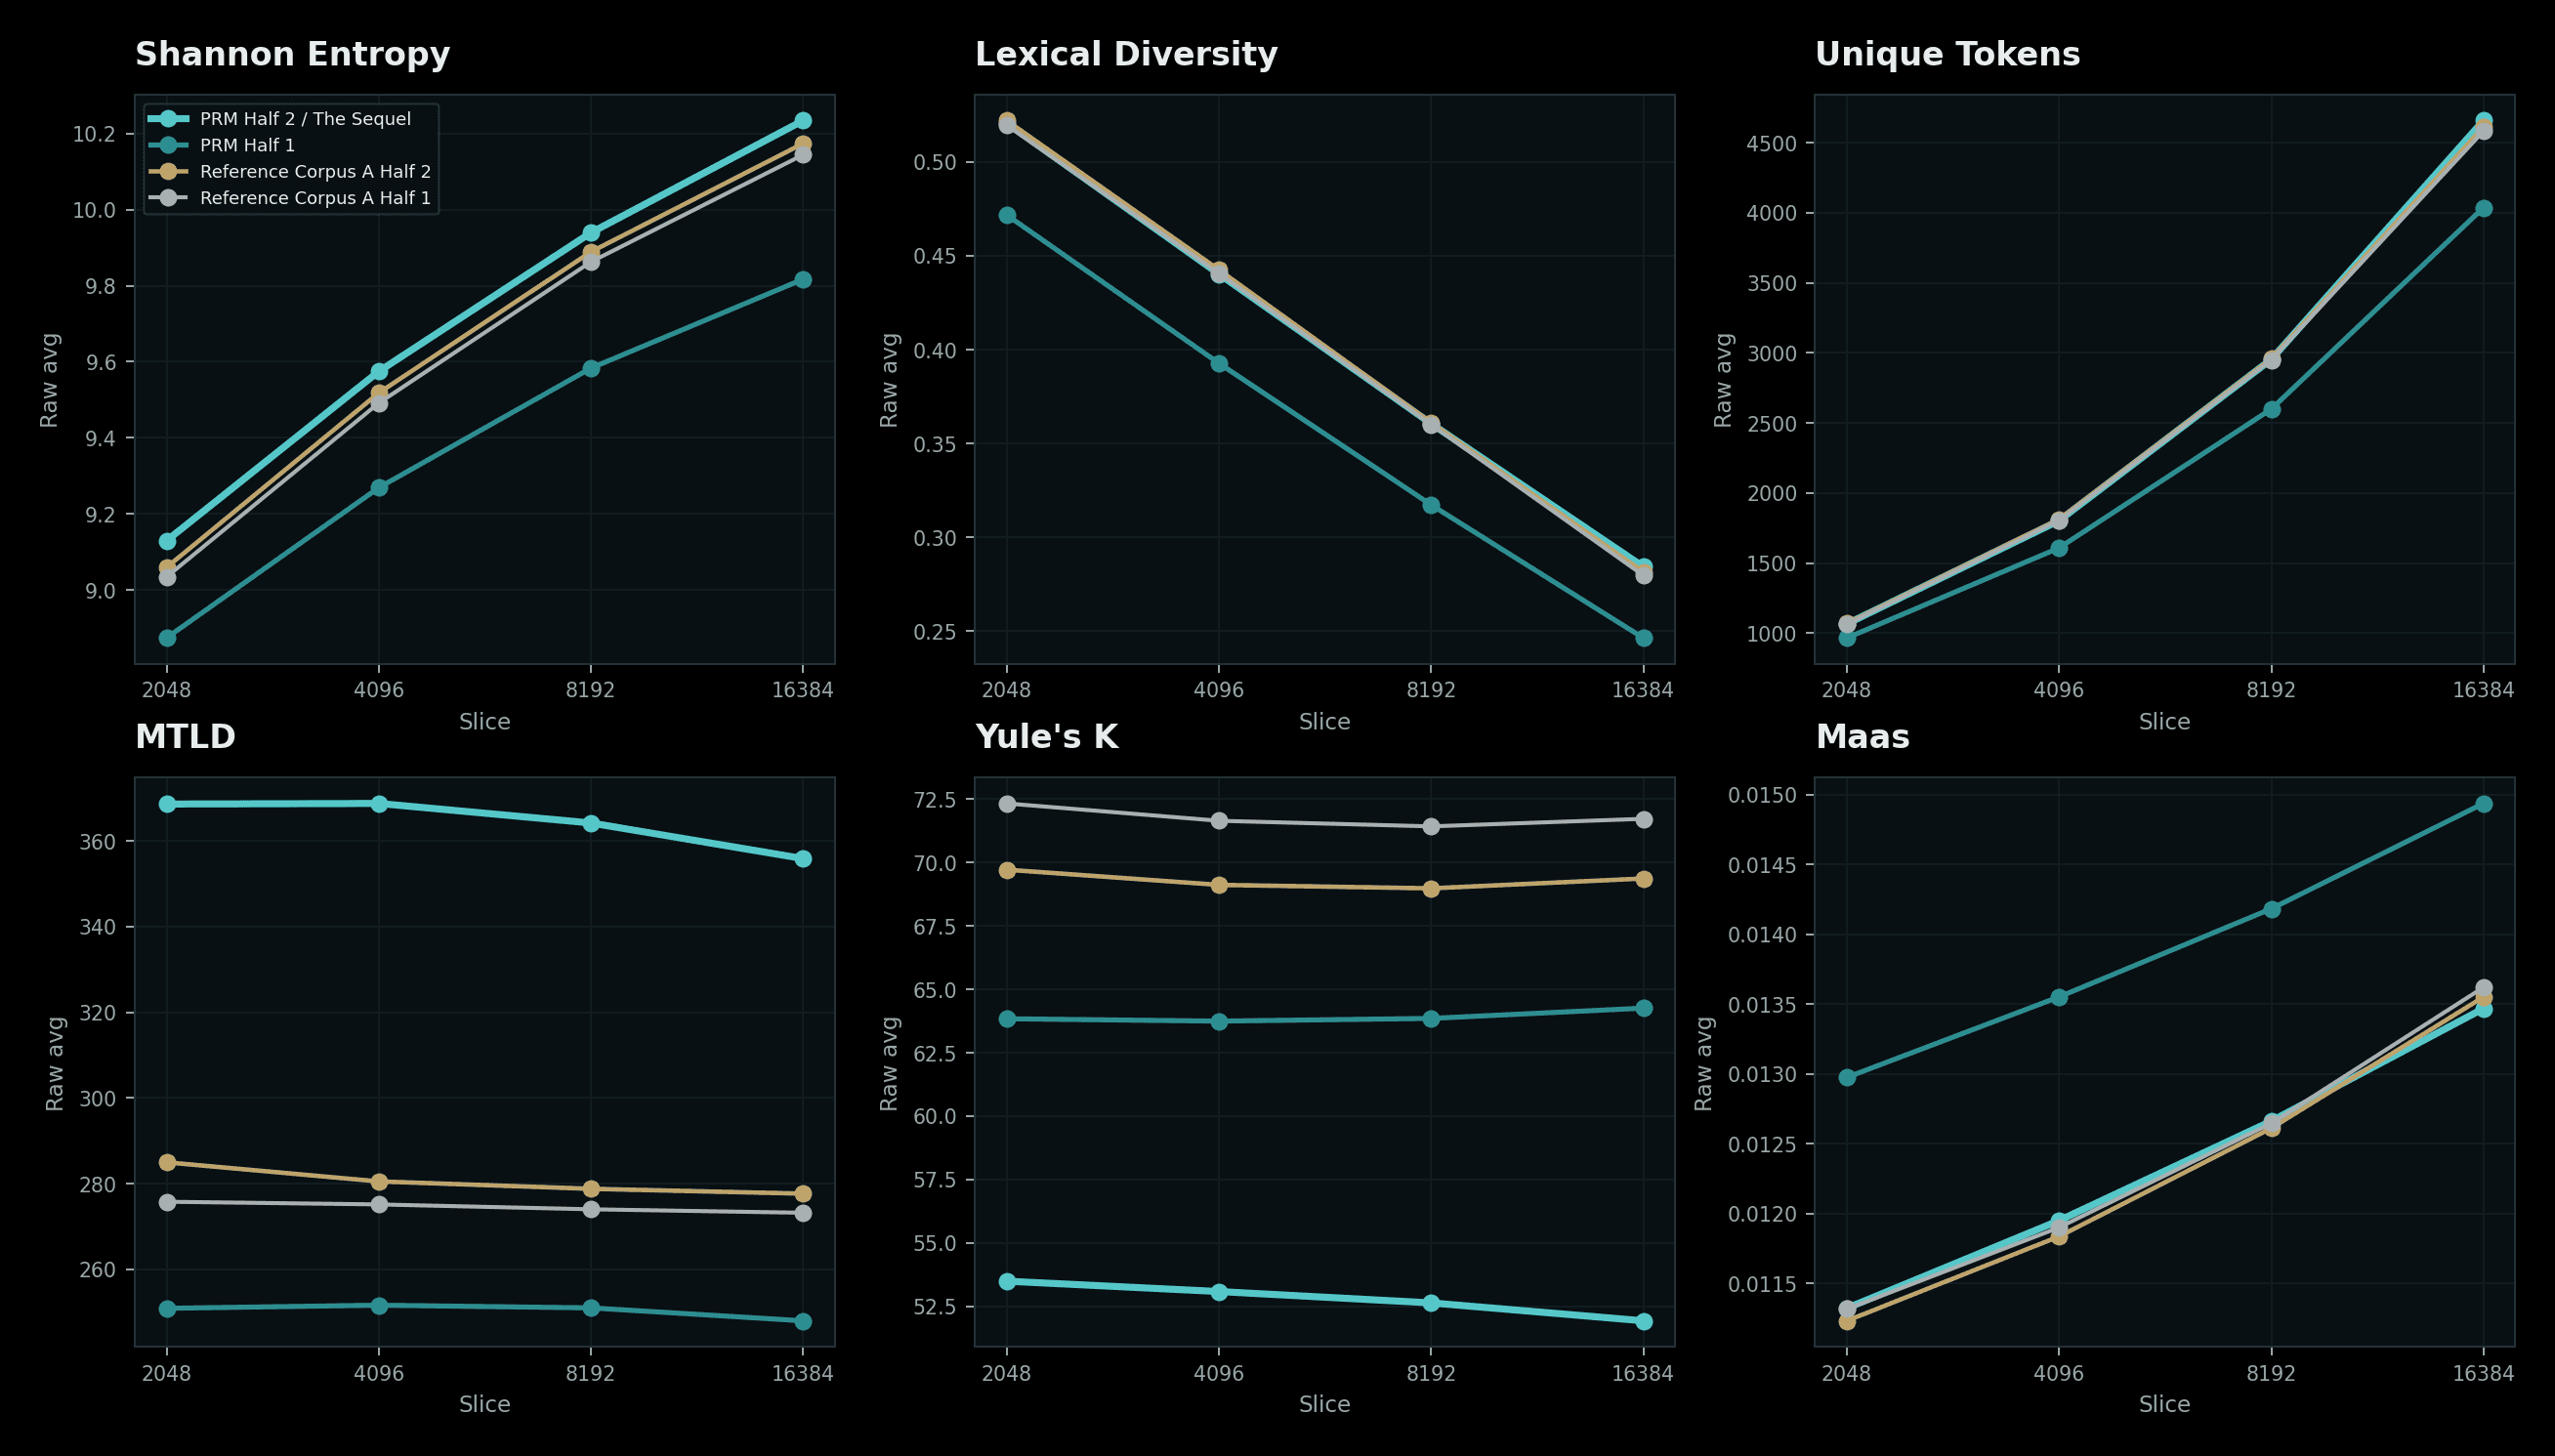
Raw metric trends across focus segments
Raw metric trends across focus segments
Tracks major raw metrics across large-window focus segments.
Tracks major raw metrics across large-window focus segments.
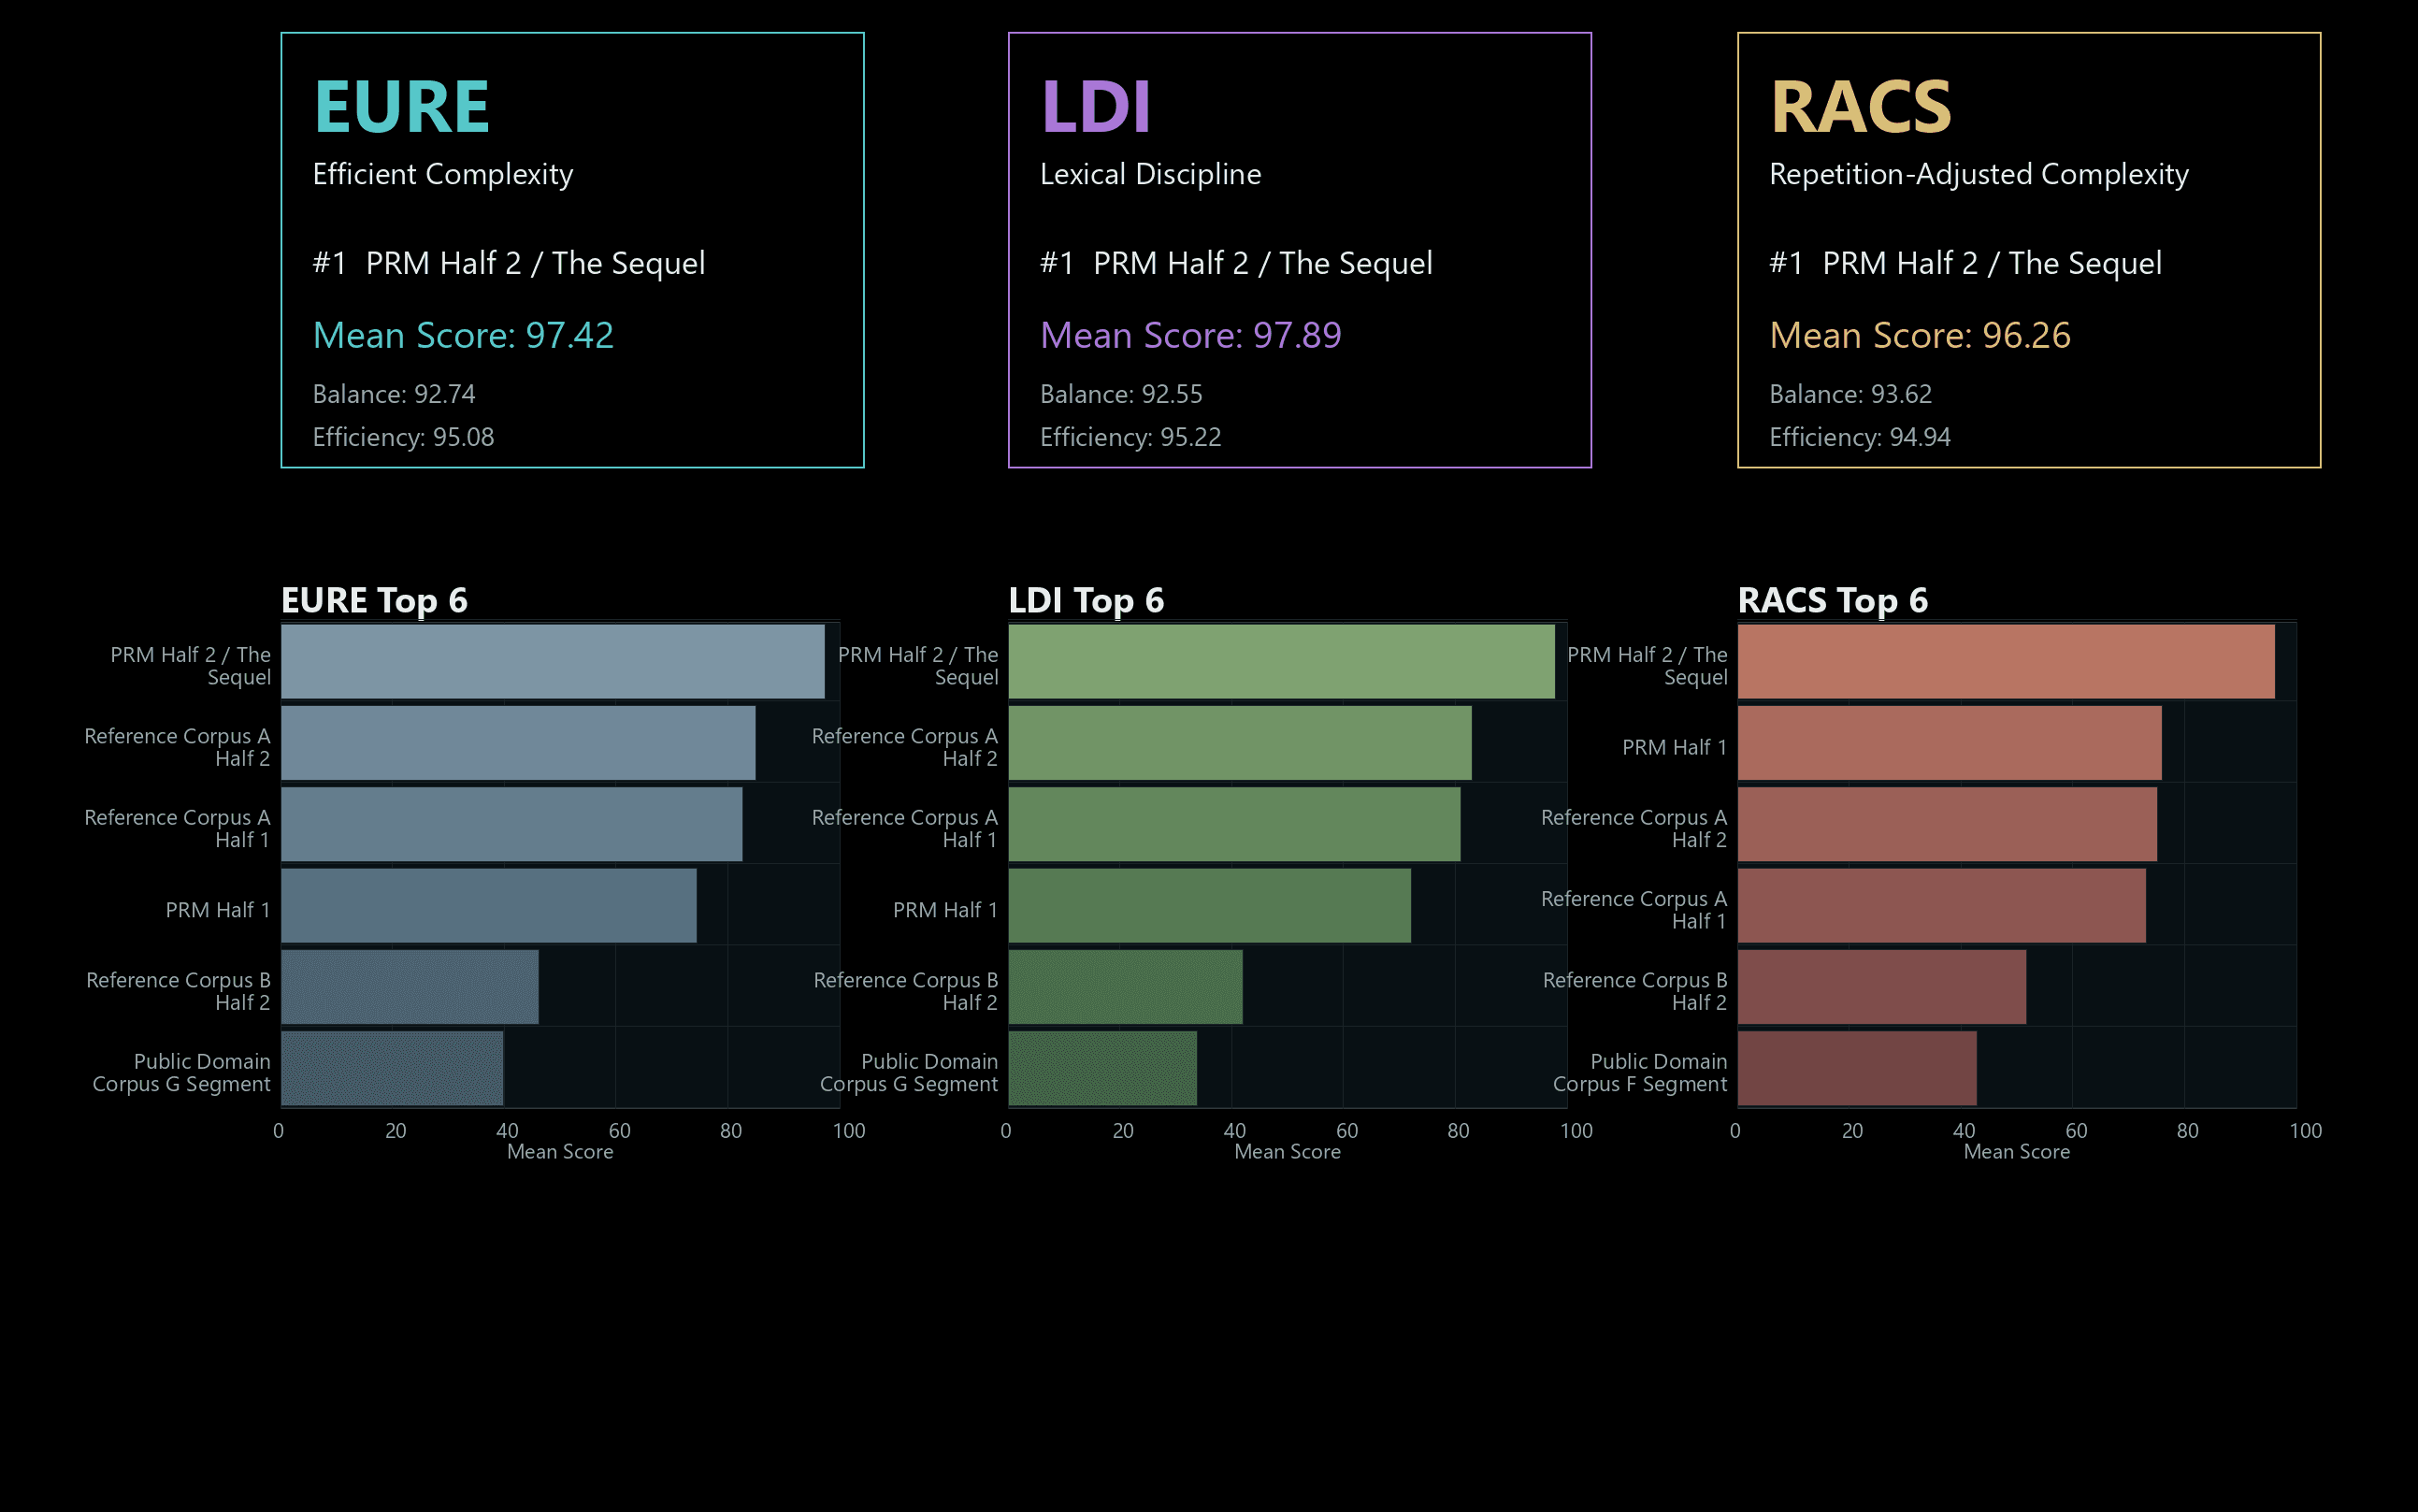
Metric index web dashboard
Metric index web dashboard
Summarizes the EURE, LDI, and RACS index layer for the public site.
Summarizes the EURE, LDI, and RACS index layer for the public site.
Pipeline Chart Boundary
Pipeline charts show aggregate output behavior and coverage patterns. They do not publish protected source text, private manifests, or reconstructable source maps.
Pipeline charts show aggregate output behavior and coverage patterns. They do not publish protected source text, private manifests, or reconstructable source maps.